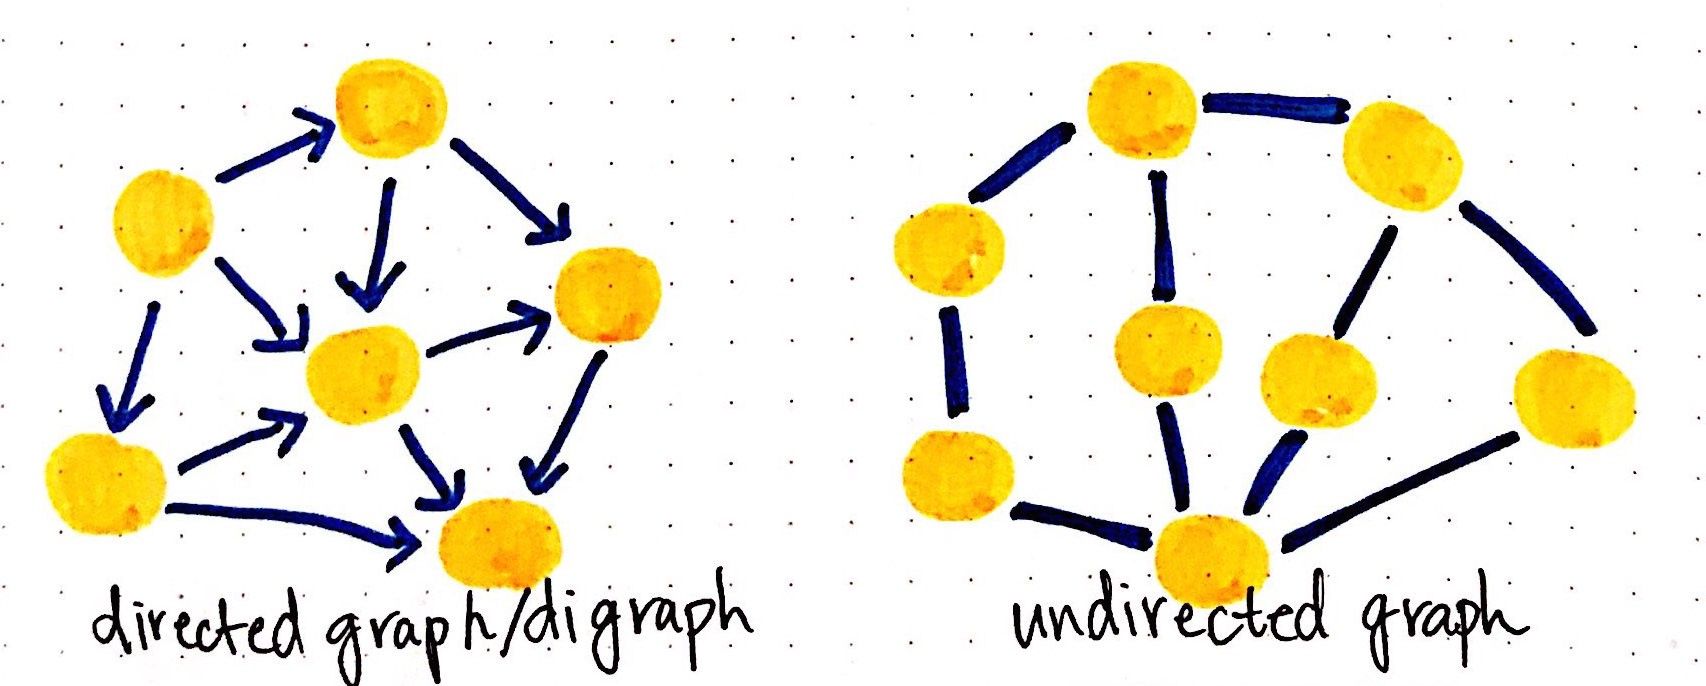
Trees are nothing more than restricted types of graphs, just with many more rules to follow. A tree will always be a graph, but not all graphs will be trees.
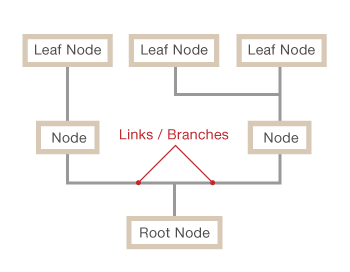
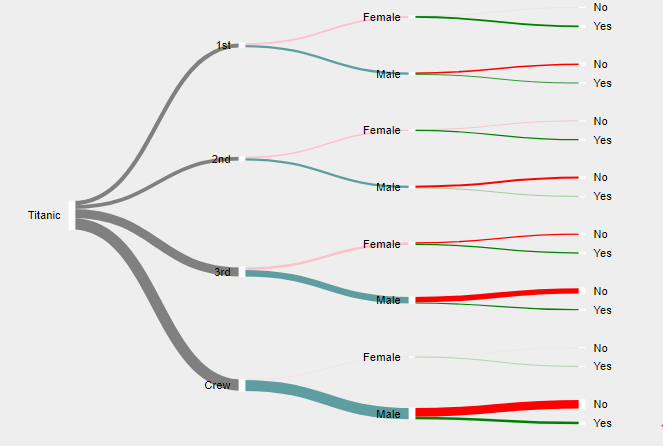
A tree diagram or graph is best used for a sequence of events - it's hierarchical and shows the relationships between whatever value is inputted. It's often used with fractions to show probability.
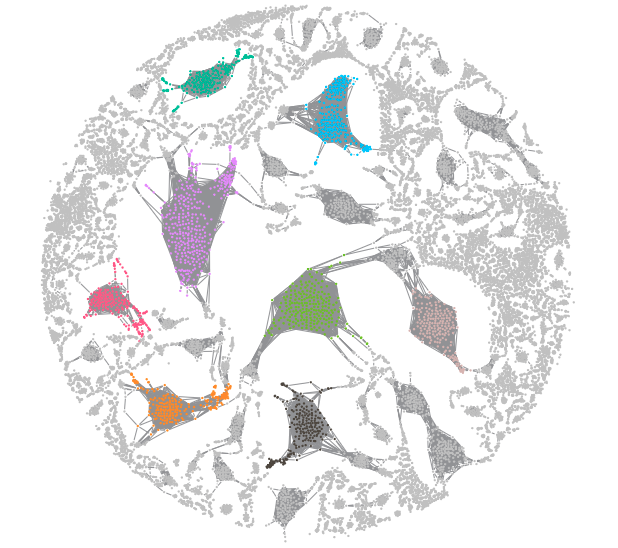
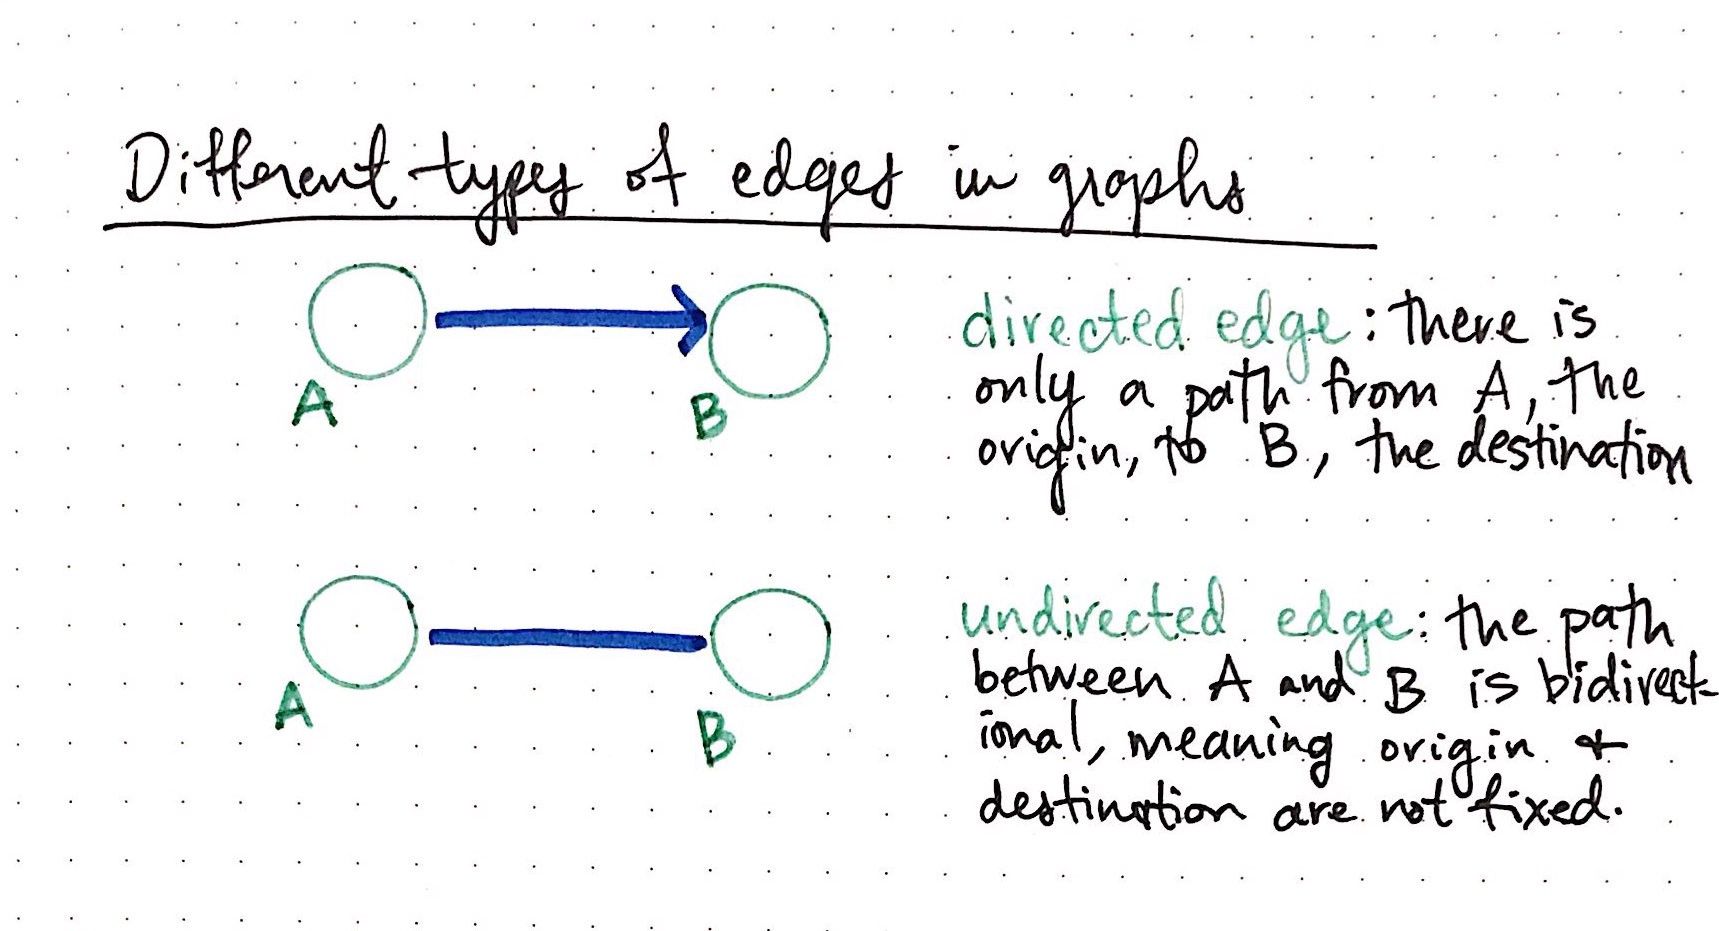
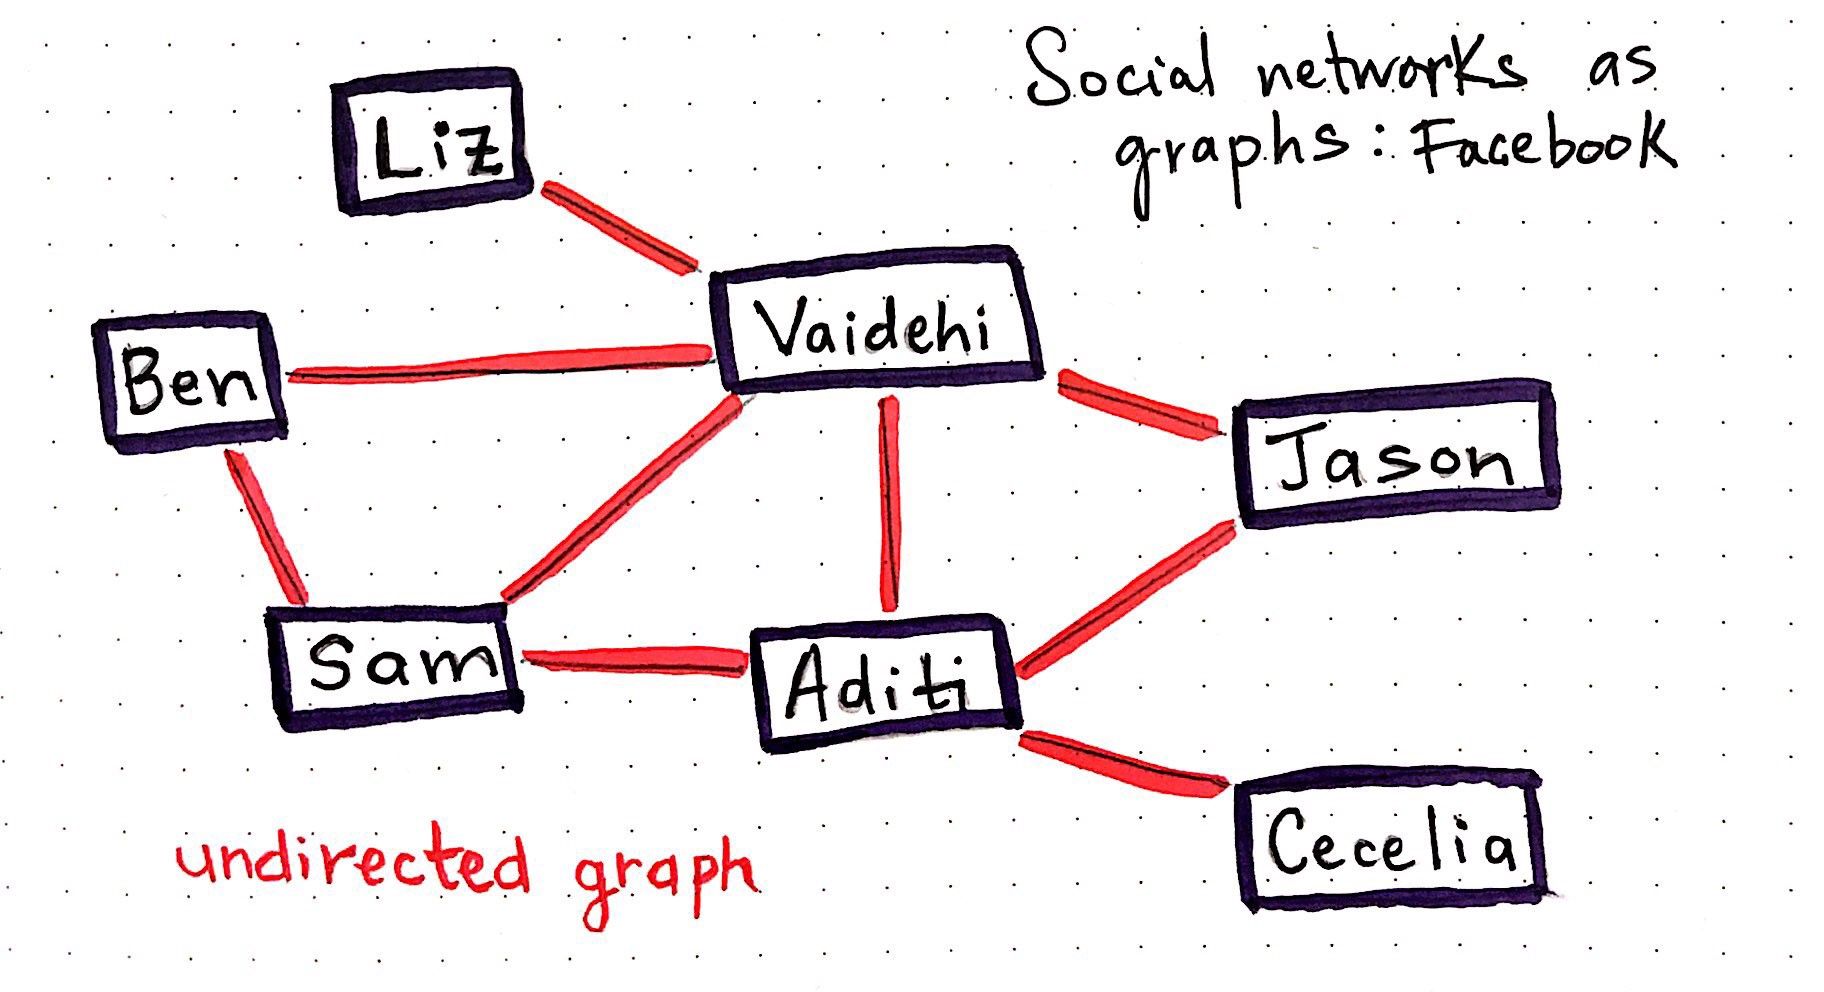
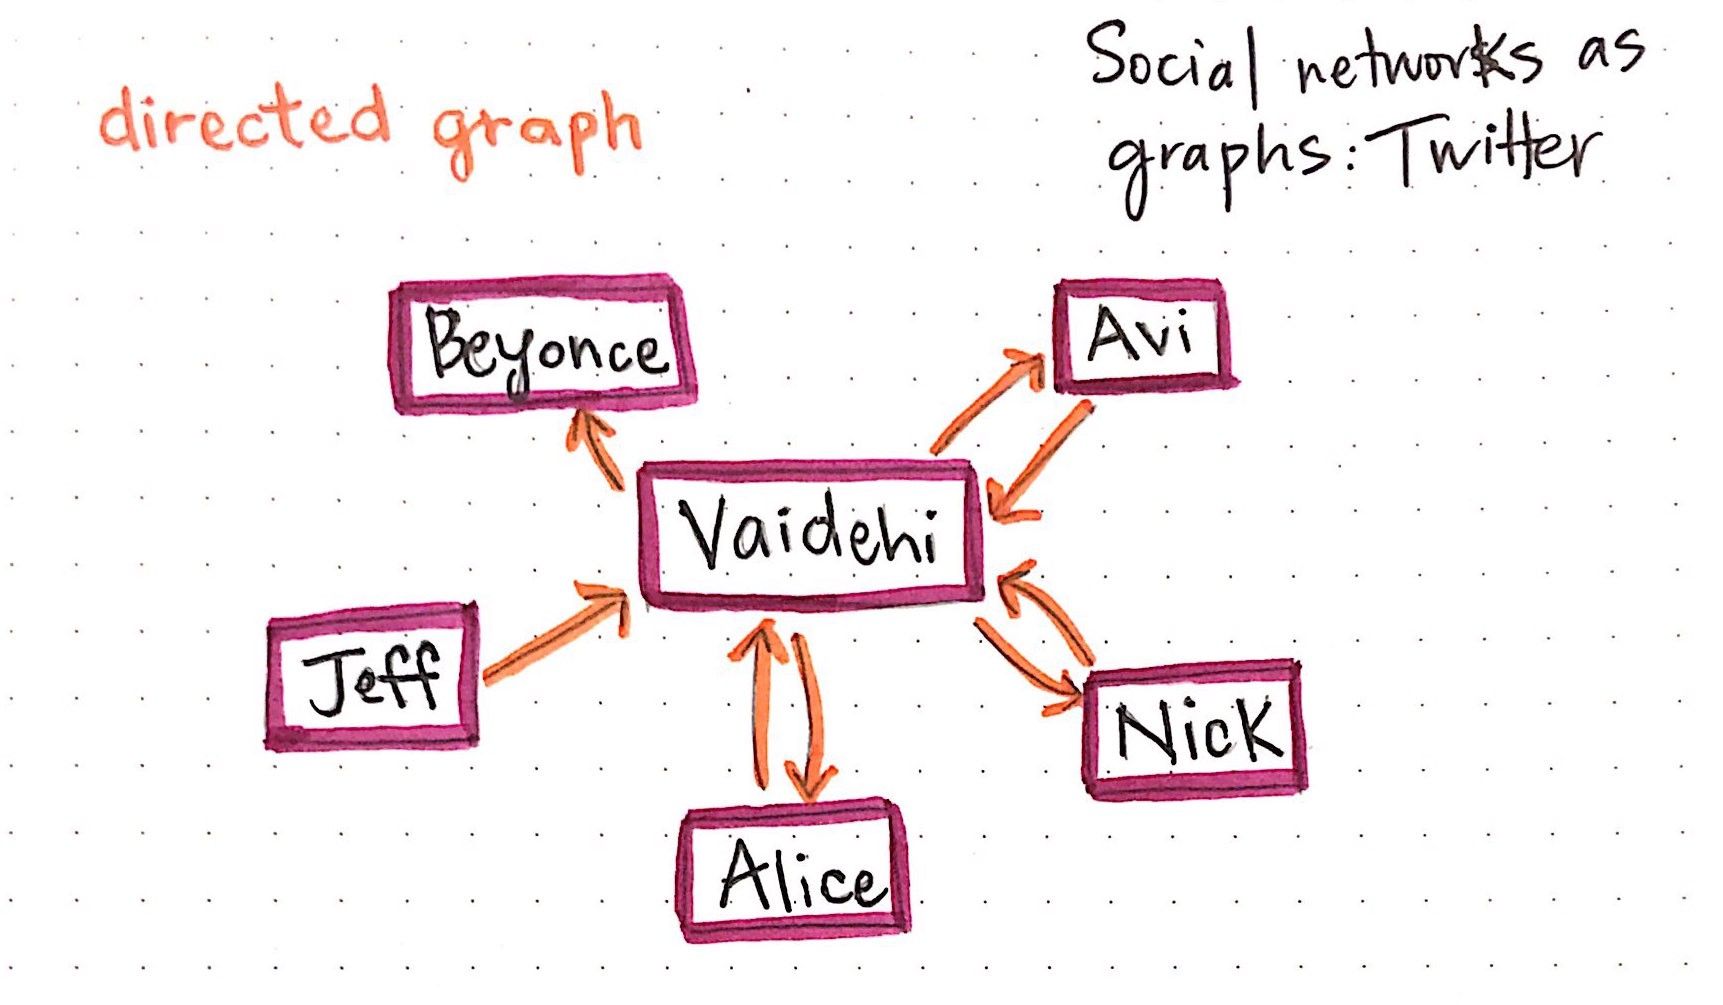
'Position' is a key visual variable in a tree diagram, less so in a graph, as every value's position relative to another is what represents the hierarchy. In a graph, values can basically be anywhere so long as they're visually connected in another way.
Other visual variables can be used to show classifications / groupings within the overall structure, how connected values otherwise differ.
As far as pre-processing, there doesn't seem to be any specific methods needed for trees & graphs so long as the data can be appropriately analyzed (if labels instead of purely numerical) and the data is categorized.
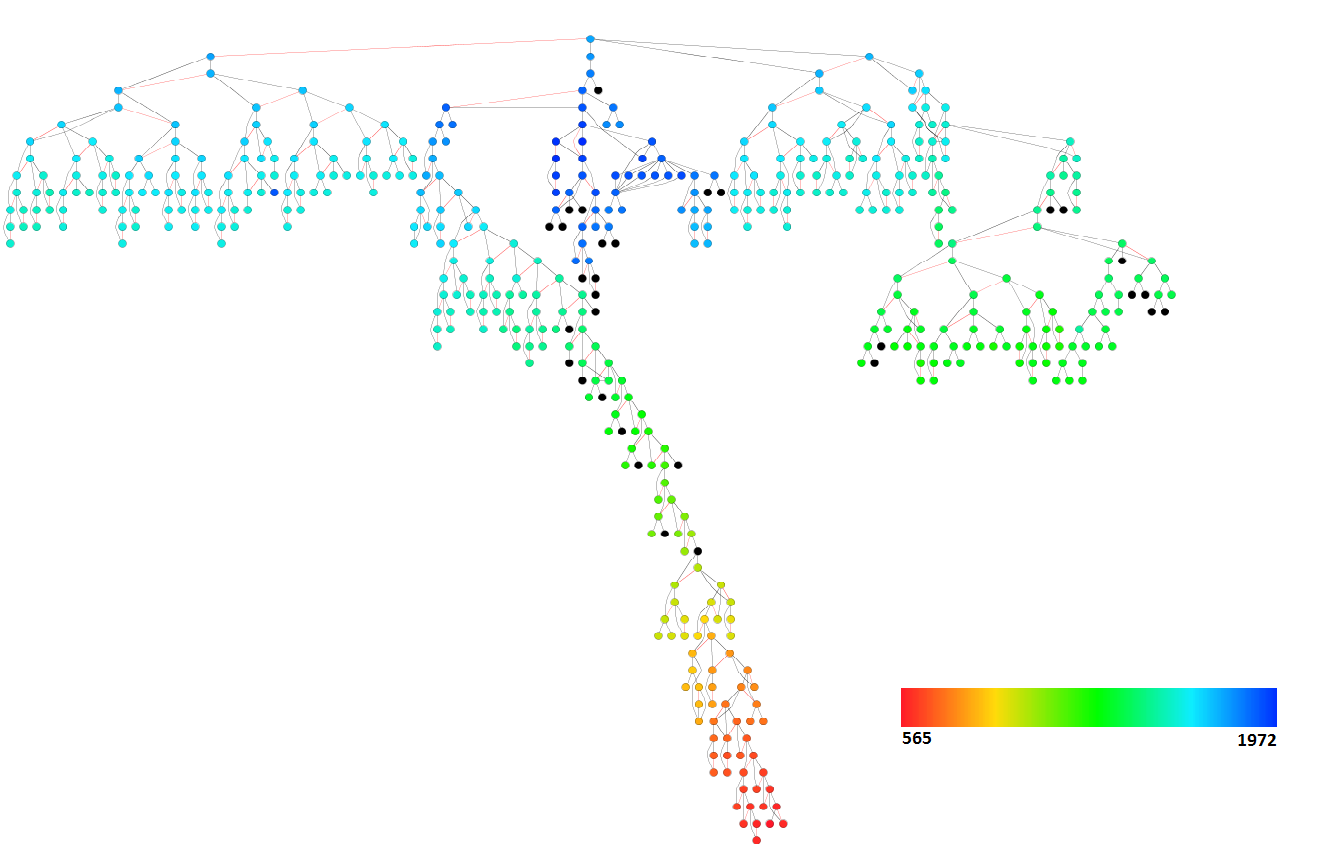
'Good' Examples
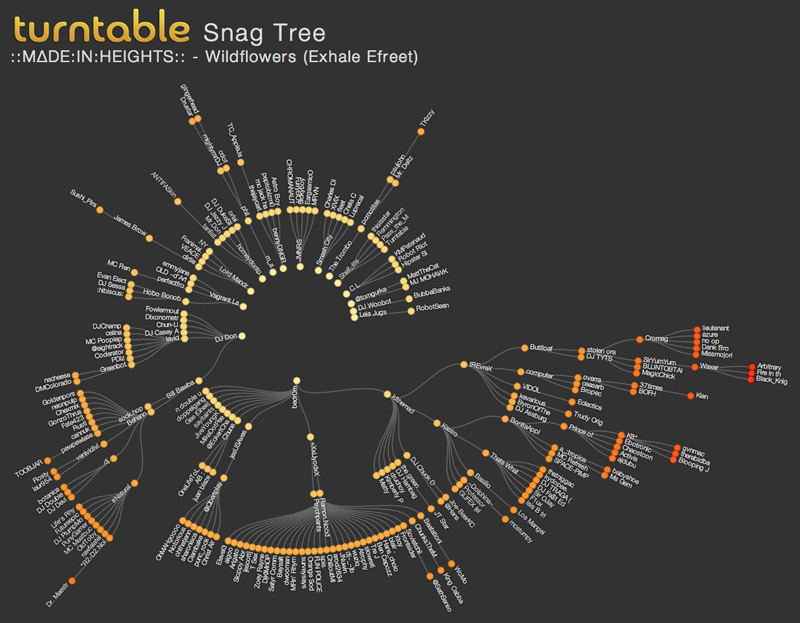
'Bad' Examples