DEFINITION
Bar graph is the easiest way to present the data. A graph showing the table as a bar. Bar charts can easily compare the number of each figures and show a more accurate number than other graphs. Therefore, Bar graph is an effective way to compare items between different groups. However, there is the downside that you cannot predict the small changes of figures.
Bar graphs consist of two axes. On a vertical bar graph, as shown above, the horizontal axis shows the data categories.
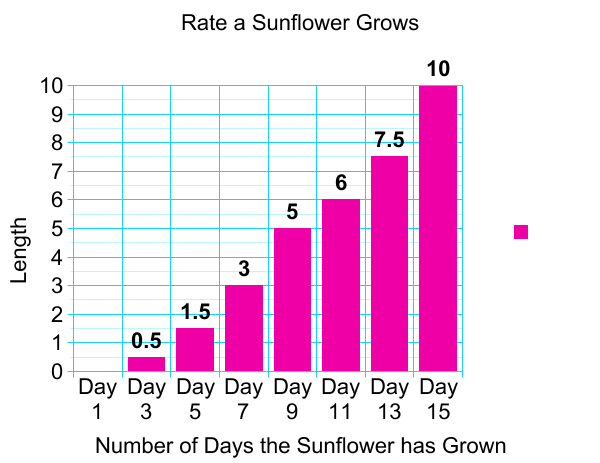
EXAMPLE
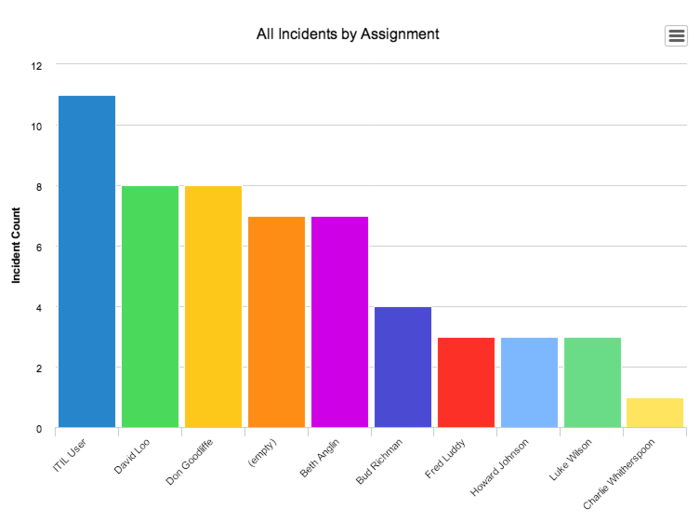
Good Bar Graph
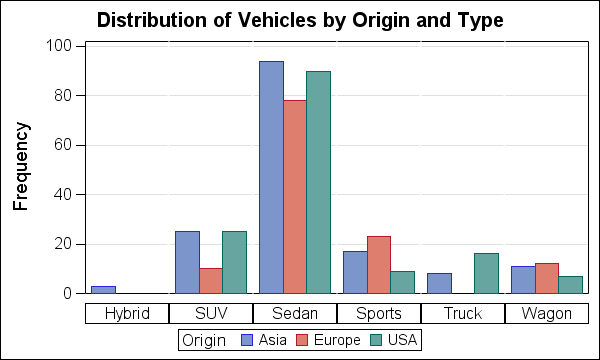
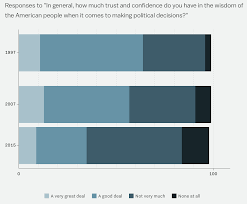
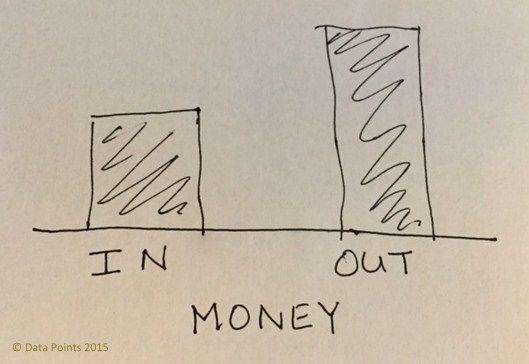
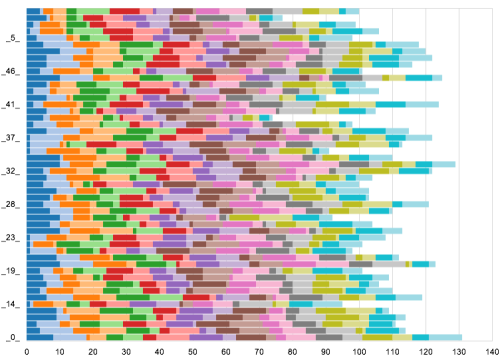
Bad Bar Graph