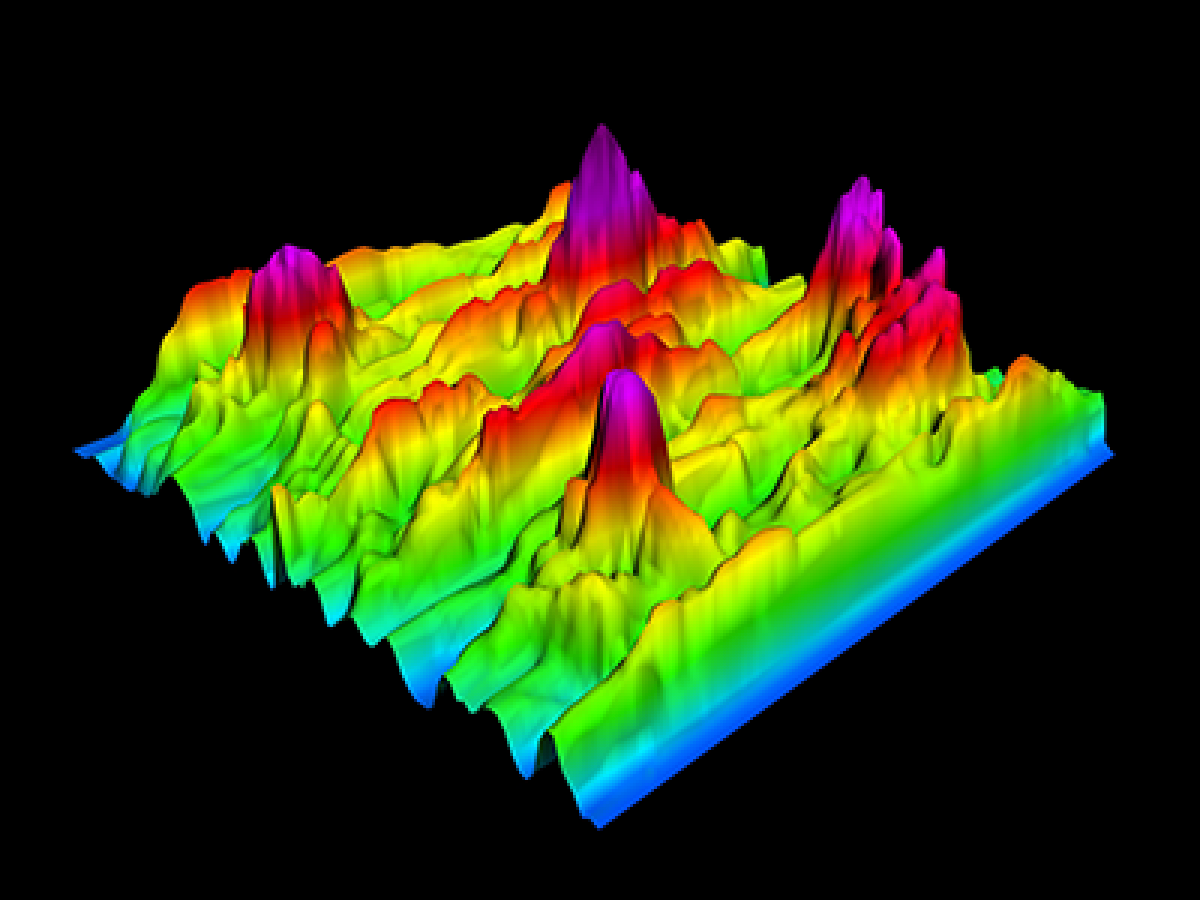
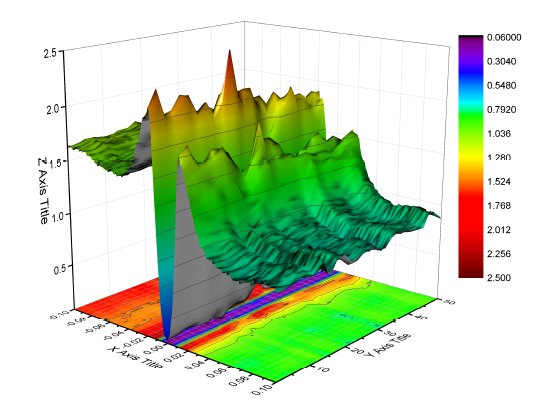
Rubber sheets are a type of data visualization chart that functions similar to a heat map but uses colored, three dimensional surfaces to map four or more dimensions.
Rubber sheets represent values such as depth, altitude while encouraging comparison of heights, general landscape, etc. However, due to the visualization type, it is not precise when concerning viewer's understanding of the relative value and any specific numeric values.
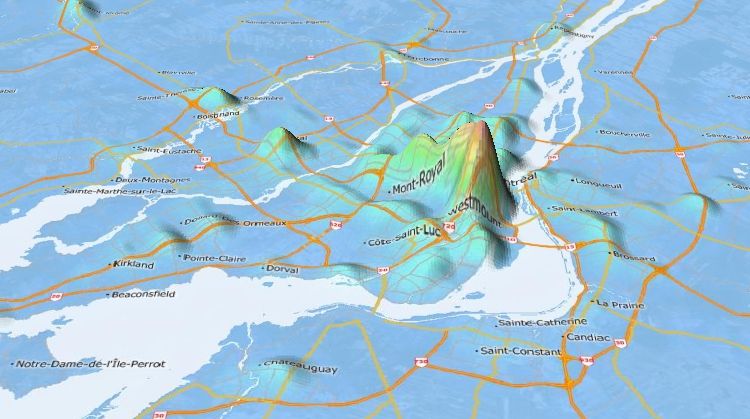
Typically, rubber sheet charts are used to explain and lay out geo-related information. Height and colors signify two seperate input values.
Rubber Sheet can be compared with Isosurfaces, which have similar features.
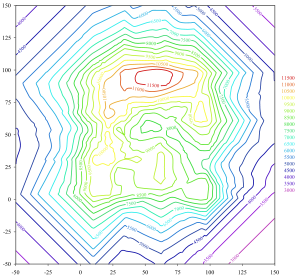
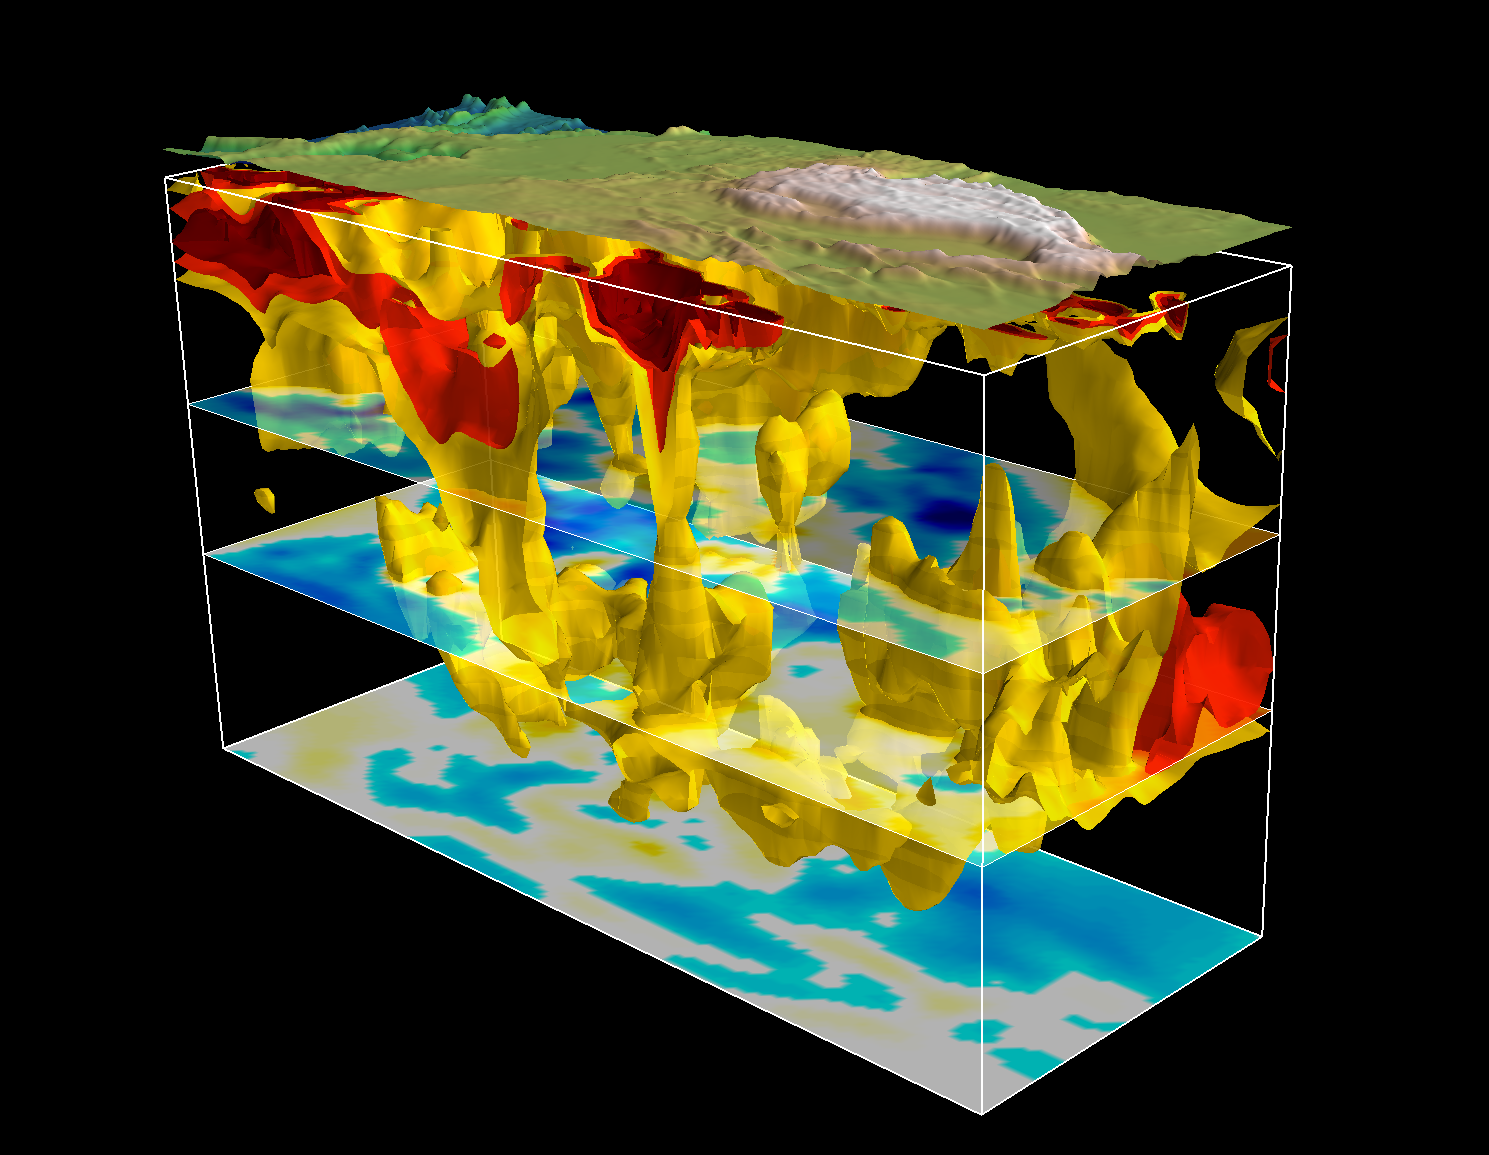
Isosurfaces are maps of data that resemble topographic maps and are commonly used to visualize temperature, weather and Ocean currents.
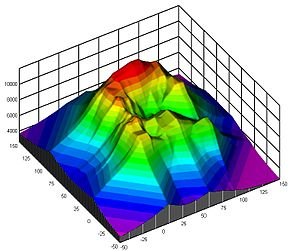
An isosurface represents points of a constant value (e.g. pressure, temperature, velocity, density) within a volume of space.
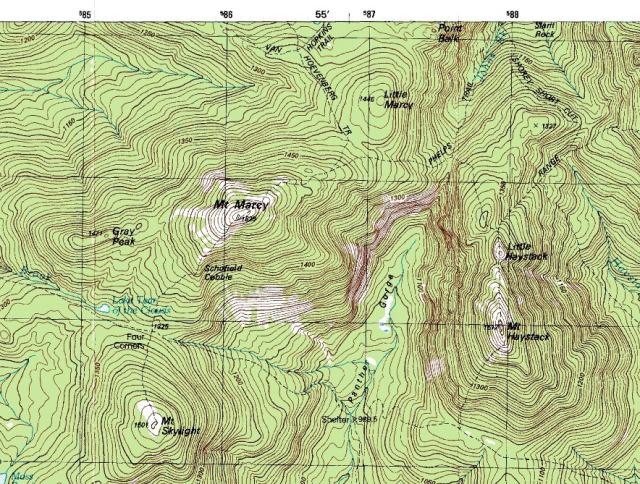
Below are examples of isolines...
One may extrude from isoline to isosurface in order to give the viewer greater clarity about value meaning. By adding height and depth, it can be easier to communicate and visualize the value differences.