In the introductory chapter of Kierann Healy's Data Visualization for Social Science, the author iterates the importance of understanding and creating data visualization that is both highly functional and highly understandable.
Data surrounds us, and the visual explanation of information relevant to viewers allows for us to create correlations and relationships that we would not be able to when presented with a set of numbers or statistics. Healy notes that the outcome one takes away from a visualization can greatly vary based upon choices made in order to represent the data.
Healy specifically notes three aspects that make bad figures bad, these being bad taste, bad data, and bad perception. Bad taste may be simply explained in some ways as over-design... when designers add unnecessary or distracting elements that make interpreting the intended message harder.
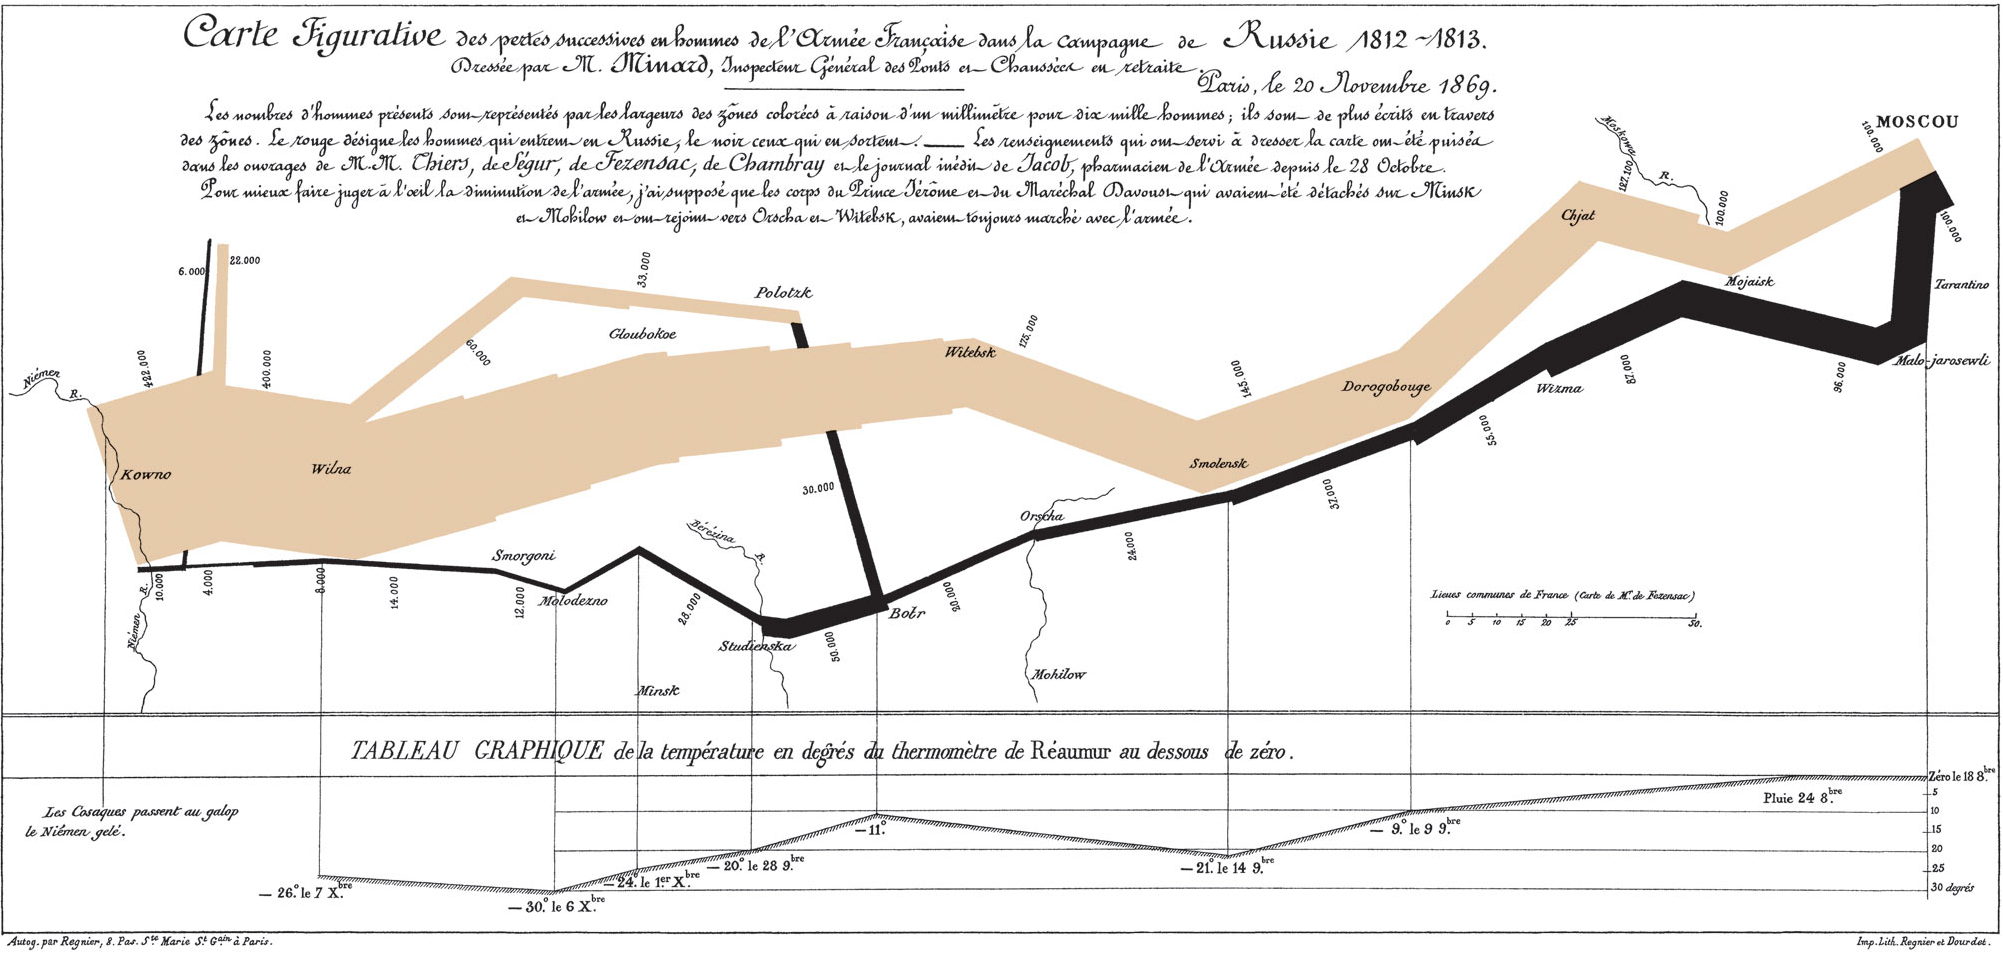
Healy cites Edward Tufte's thoughts on Charles Joseph Minard’s visualization of Napoleon’s retreat from Moscow, noting that the figure (regarding the image above) "can be described and admired, but there are no compositional principles on how to create that one wonderful graphic in a million.”
While the author seems to state that routine and more imitable data images are what one should strive for and are what are considered well designed, I would say that the content of data to be explained drives the design of the graphic used to explain it and thus, does not neccessarily have to be repeatable or multipliable.
Regarding the balance between content and the graphics, In Healy's own words, it is "better to begin by thinking about the relationship between the structure of your data and the perceptual features of your graphics." To me, this was one of the most important pieces of the reading, as it simplifies the basic concept of data visualization and what one should strive for in order to achieve harmony between understanding the message of data, and its visual appeal.
While data visualization deals with objective, quantifiable data, there is definitely no definitive answer when tasked with presenting the information in the best possible way. When considering the goal of presenting data, one must ask what the purpose of the presentation is.
I would ask whether one of data visualizations subliminal goals is to instill human reaction, either emotional or opinionated.