- Catalog & Classify
- Discussion of your findings
- Exercise: Jacques Bertin and the seven "Retinal Variables"
- Download a copy of this worksheet (it's an Illustrator-friendly PDF)
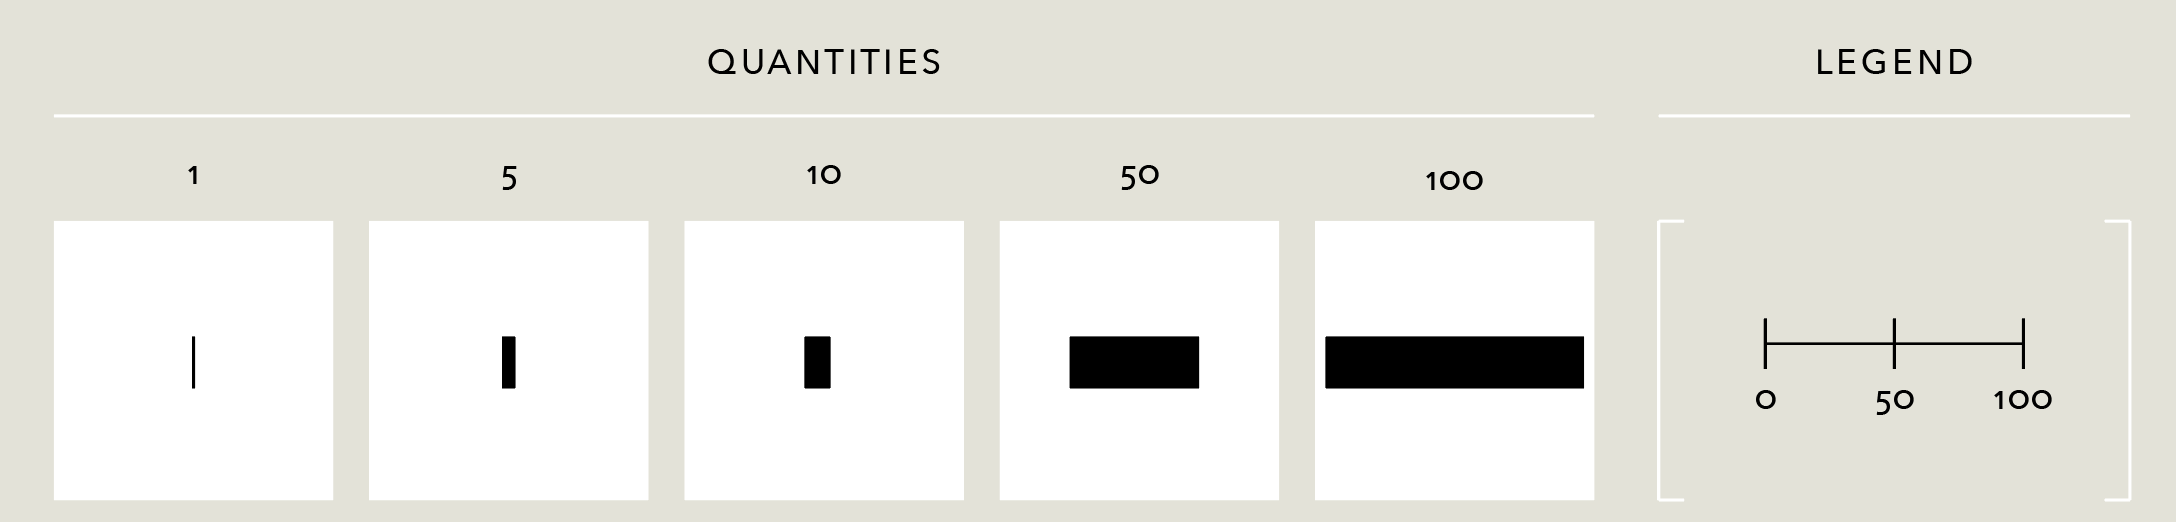
- Using the vector drawing software of your choice, fill in all the cells of the empty grid you see sprawling before you. Each cell should represent the numerical value denoted by the column using the retinal variable corresponding to its row.
- Note that each retinal variable has two rows devoted to it: construct a distinct 'rule' for how to encode the values for each and try to make them as different from one another as possible
- Off to the side draw a key or legend that would allow a viewer to 'decode' the original number based on its visual representation
- Nothing but a Number
- Get started on our first real project of the semester
Assignment
- Retinal Variables
- Come to class with a Illustrator/Sketch/Figma/etc. version of your worksheet with two variations for each of the retinal variables.
- Export a PNG version and embed it in a blog post using the tag
Retinal Variables. After you publish it, make sure your post is visible here.
- Nothing but a Number
- Each day, find a number of interest and then design a poster for it in one hour or less. Add a new heading to your blog post identifying the day of the week and upload a JPEG or PNG of your poster. Be sure to document the source of the information in the image’s caption and include a link.
- Come to class in next week with all seven of your posters in a single PDF, ready to be screen-shared.