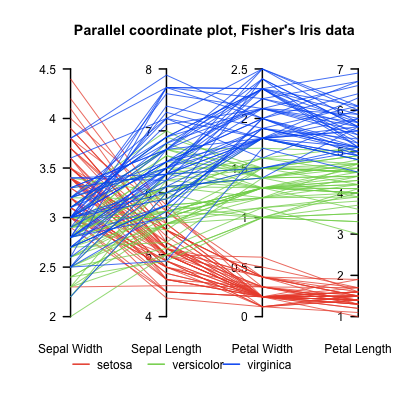
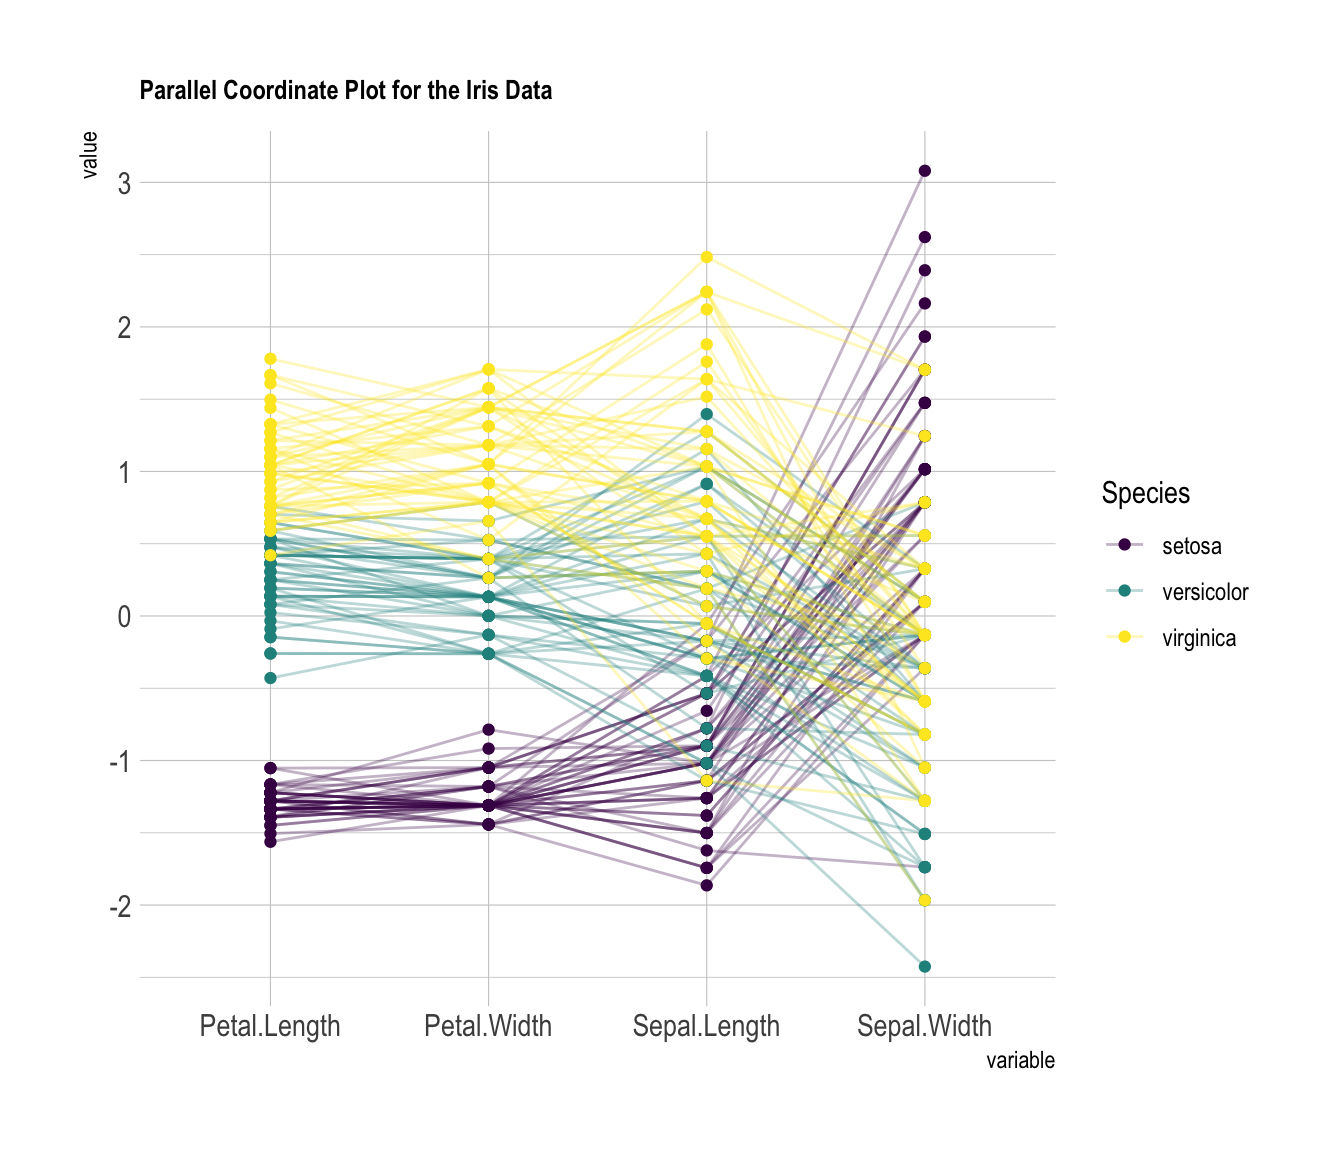
Linear parallel coordinates
Parallel coordinates are a common way of visualizing high-dimensional geometry and analyzing multivariate data.
To show a set of points in an n-dimensional space, a backdrop is drawn consisting of n parallel lines, typically vertical and equally spaced. A point in n-dimensional space is represented as a polyline with vertices on the parallel axes; the position of the vertex on the i-th axis corresponds to the i-th coordinate of the point.
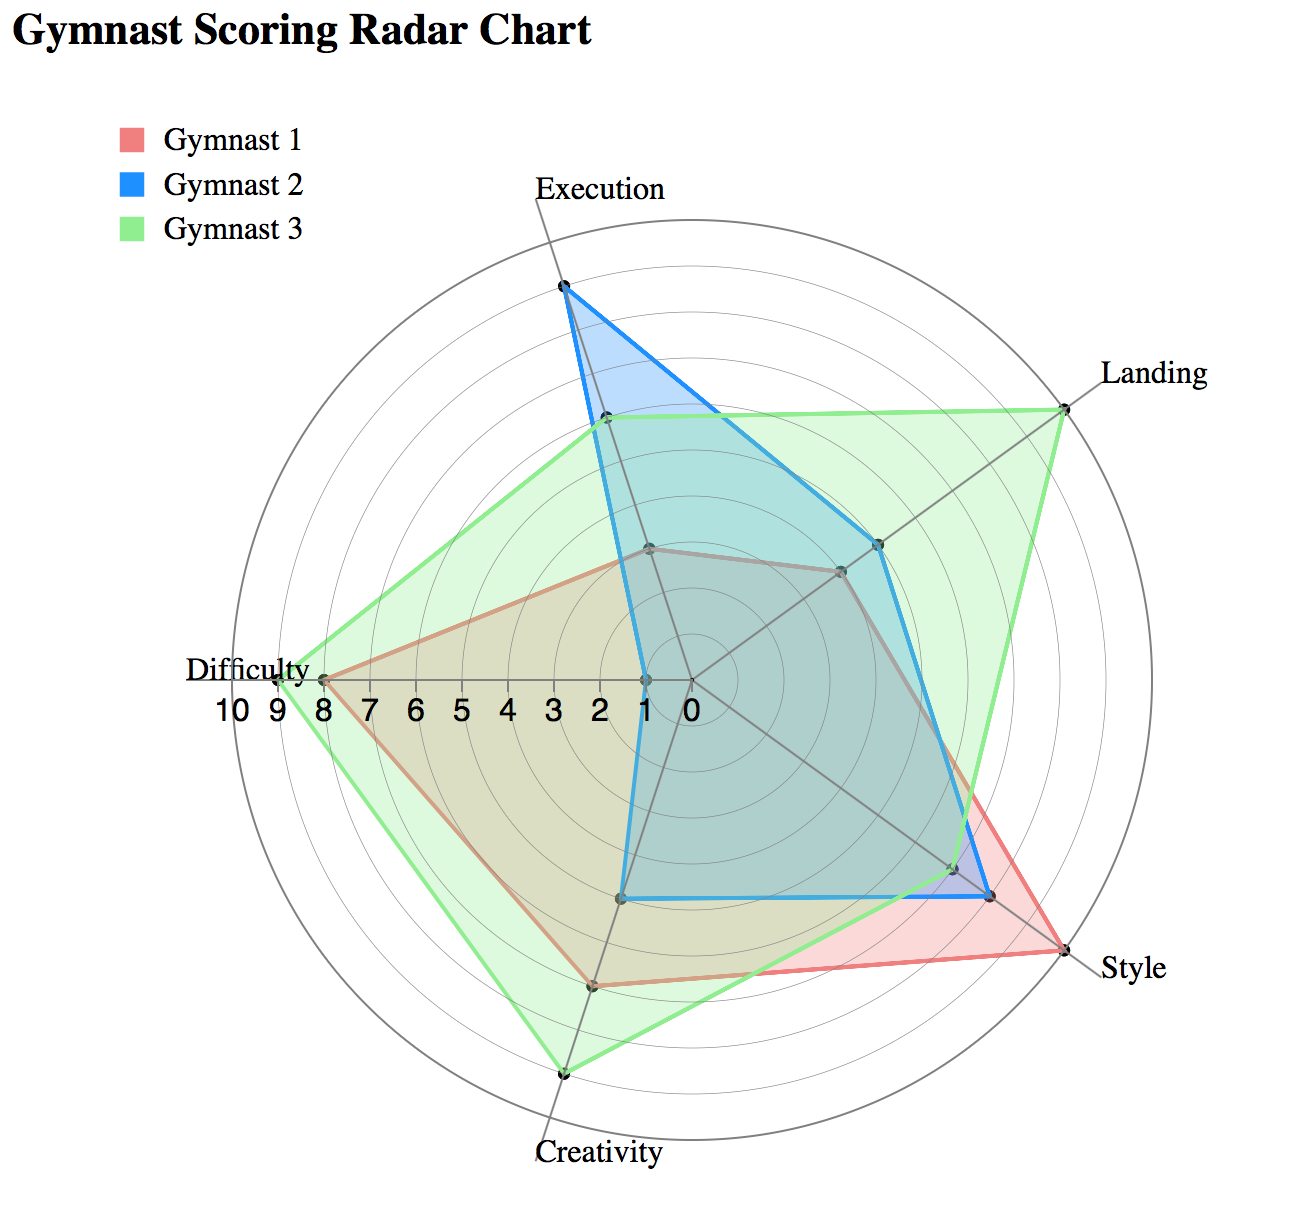
Radial Parallel Coordinates / Radar Chart
A radar chart is a graphical method of displaying multivariate data in the form of a two-dimensional chart of three or more quantitative variables represented on axes starting from the same point.
The relative position and angle of the axes is typically uninformative, but various heuristics, such as algorithms that plot data as the maximal total area, can be applied to sort the variables (axes) into relative positions that reveal distinct correlations, trade-offs, and a multitude of other comparative measures.
Advantages
- The number of dimensions that can be visualized is only restricted by the horizontal resolution of the screen.
- Correlations between variables in the dataset can be spotted easily.
Disadvantage
- Level of clutter present in the visualization reduces the amount of useful information one can perceive.
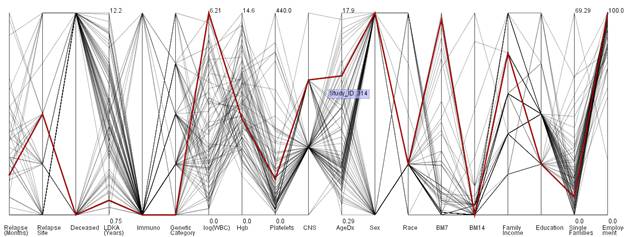
- The overlaying of data lines for common data values among data entries
- As the axes get closer it may become more difficult to perceive structures or data relations.
pre-processing
determine axes order