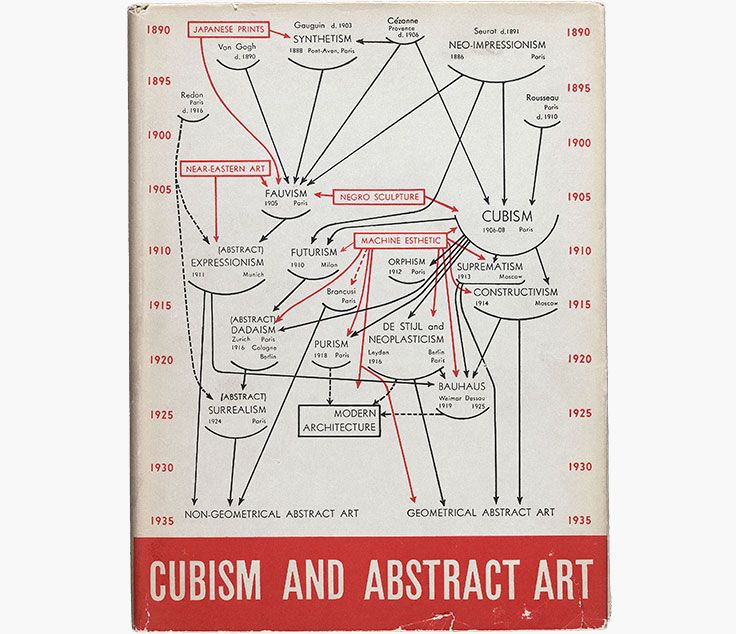
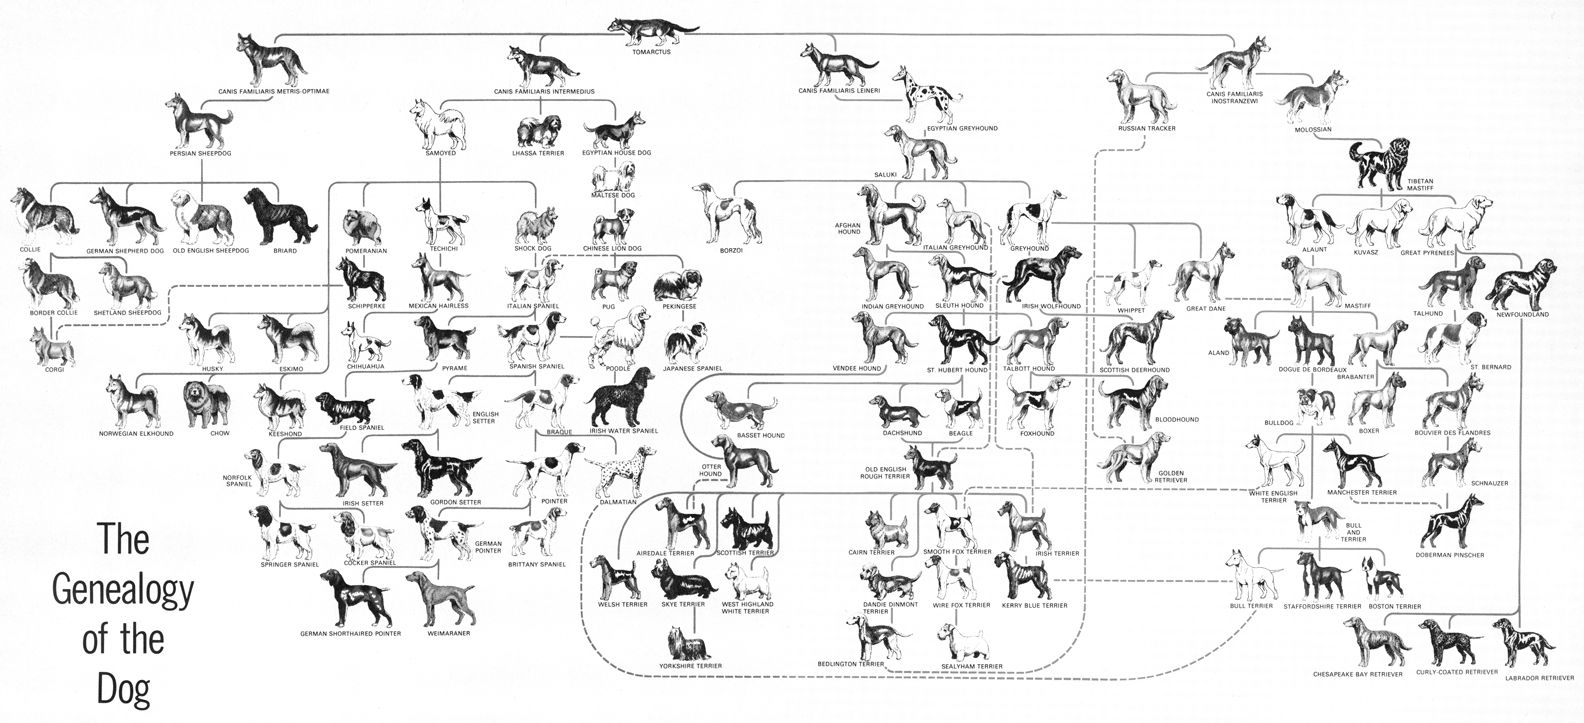
A dendrogram is a stacked tree that is shown connected to points, where the height of the branches show an additional variable. Often used to depict the stregnth of clusterings in a matrix.
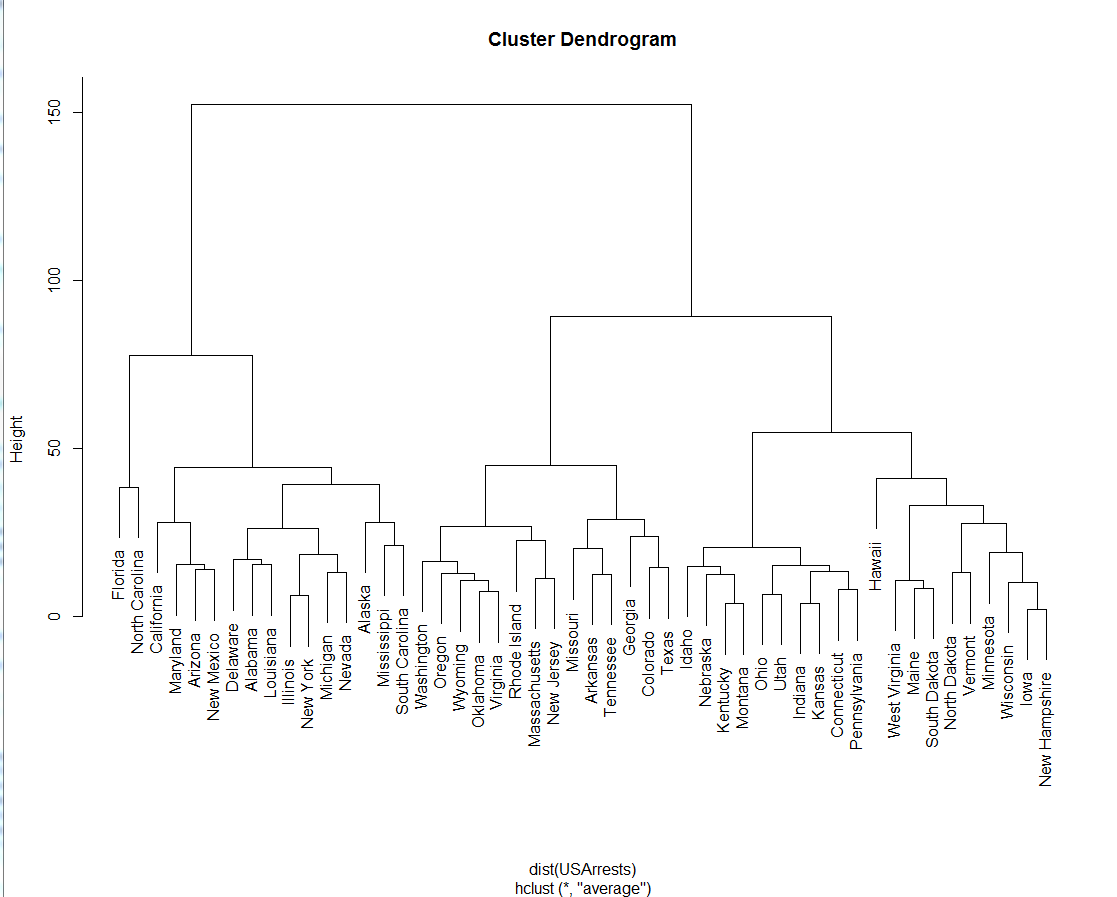
For a clustering example, suppose that five taxa (a to e) have been clustered by UPGMA based on a matrix of genetic distances. The hierarchical clustering dendrogram would show a column of five nodes representing the initial data (here individual taxa), and the remaining nodes represent the clusters to which the data belong, with the arrows representing the distance (dissimilarity). The distance between merged clusters is monotone, increasing with the level of the merger: the height of each node in the plot is proportional to the value of the intergroup dissimilarity between its two daughters (the nodes on the right representing individual observations all plotted at zero height).