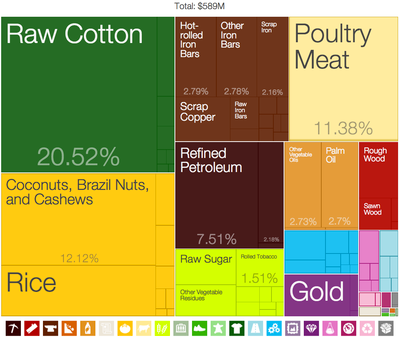
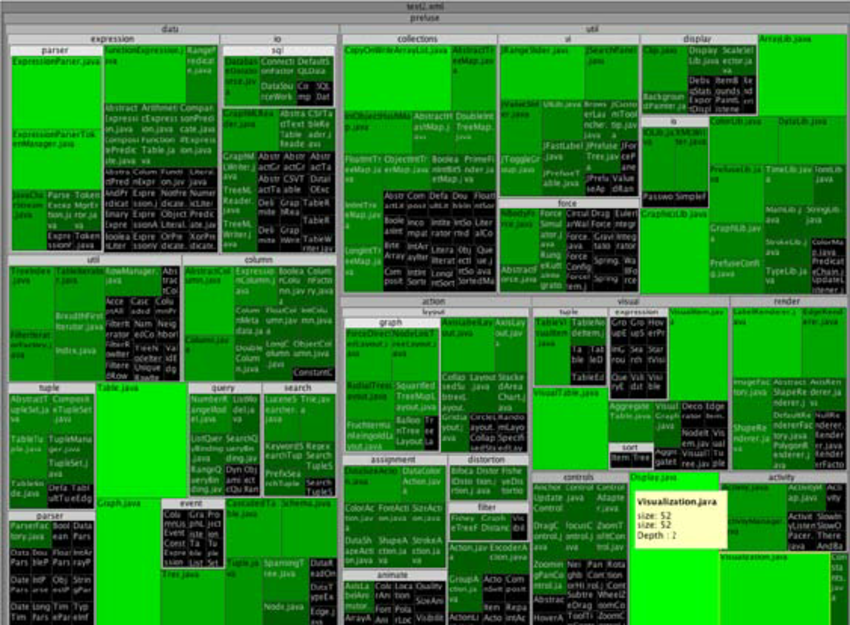
This visualization type distinguishes different sectors in the stock market using two-dimensional boxes (rectangles) within boxes where the size of the box determines the size of the sectors and the largest stocks in the market. The boxes are a quantitative representation of the stocks in the market and thus this graphic enables a quantitative comparison but not necessarily a qualitative one.
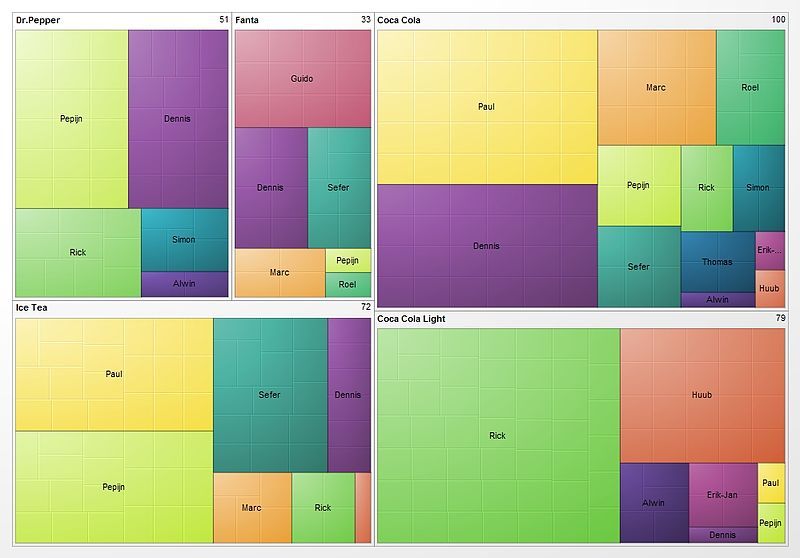
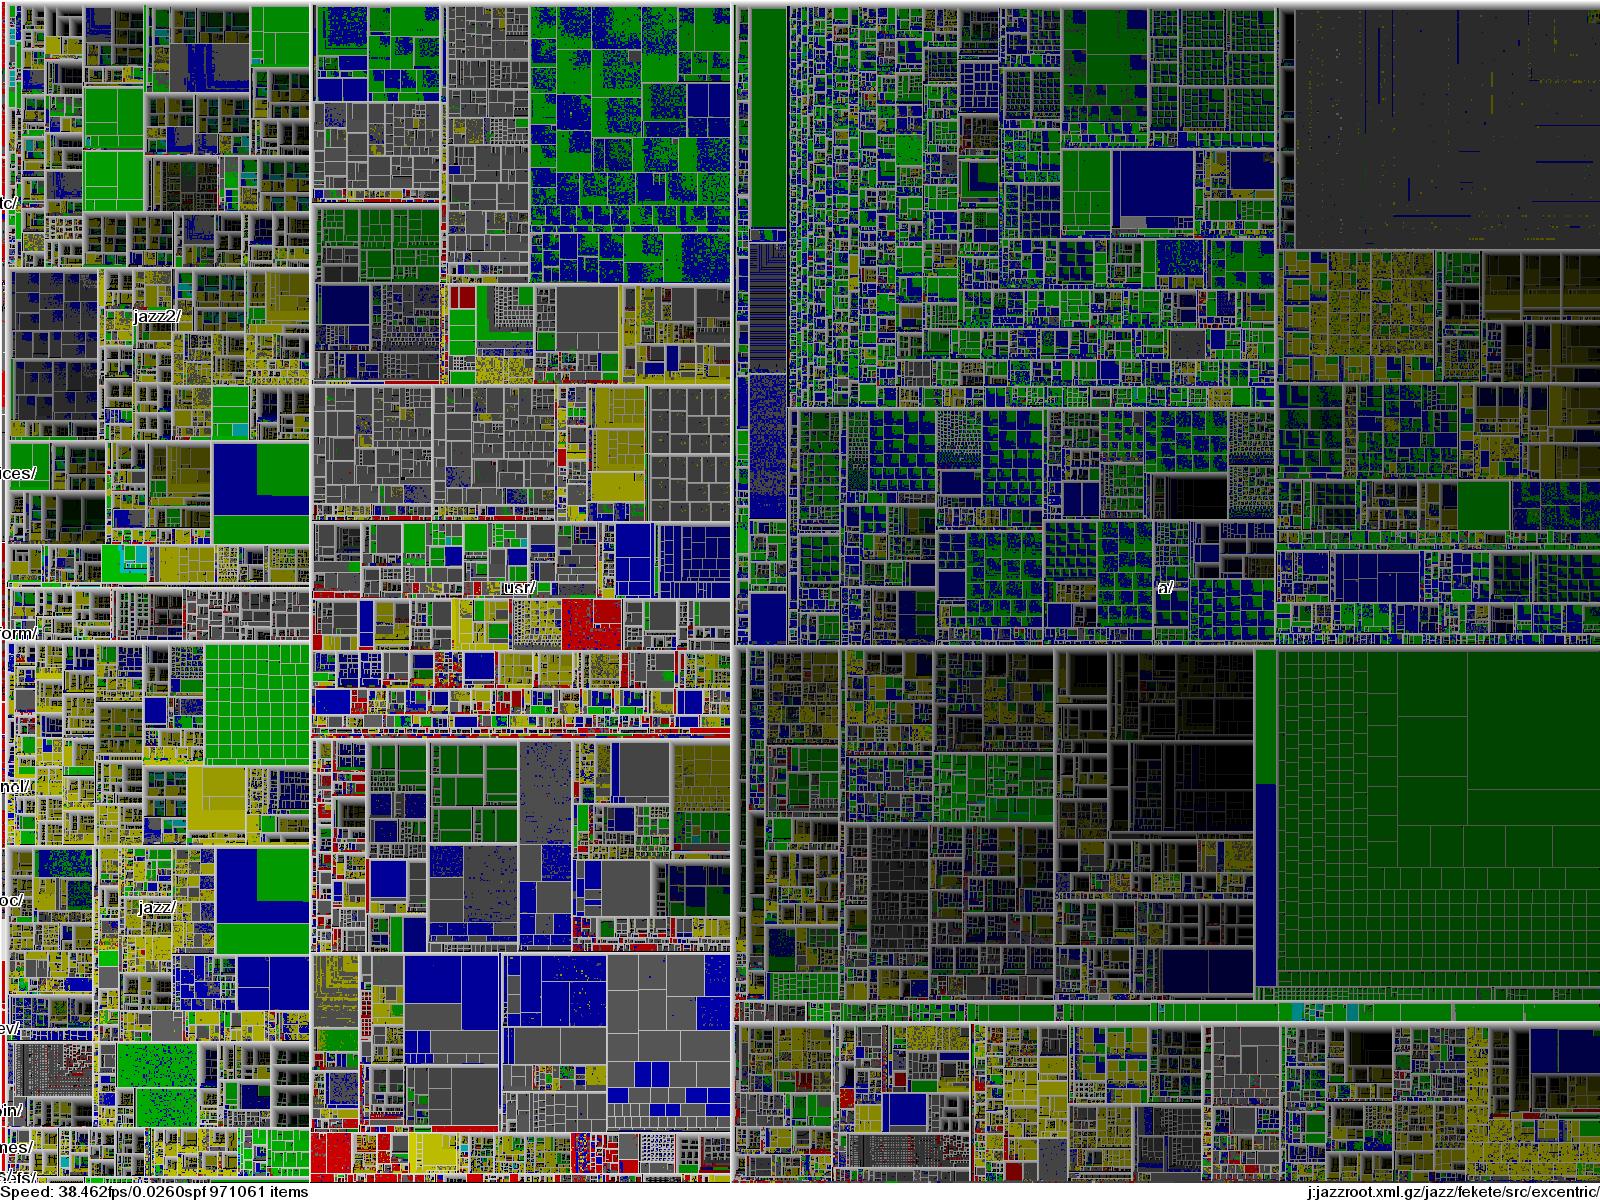
The area or size of the rectangles clearly define the data in terms of proportions or percentages. The fact that the this form of mapping uses "nested rectangles" in hierarchical order wherein these boxes are within one another enables one to see the subcategories of data in their respective quantitative representation while still being able to see the whole within which they lie.
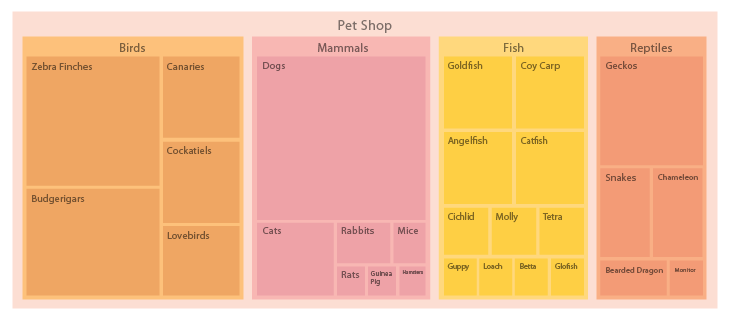
In order to effectively use tree maps for data visualization, pre-processing of the given data would be necessary and this could include categorization of the data based on some criteria for division and finding sub-categories within the same. It would also be helpful to understand similarities within these different categories so that may be represented by colors or the sizes of the rectangles.
The mapping uses rectangles to represent groups of similar data or categories within the data referred to as branches and subcategories that are represented by smaller rectangles within the larger ones. Colors are then assigned to rectangles based on the quantitative variables associated with the respective data.