Dendrograms are a type of diagram that represents data by stacking a tree form that connects points. There is hierarchical clustering as well. The height of the branches is a variable that contributes to the representation of the data. U shaped lines connect the data. Dendrograms are used in different contexts. Some of them include hierarchical clustering, computational biology, and polygenetics. Another purpose of dendrograms is to display heat maps.
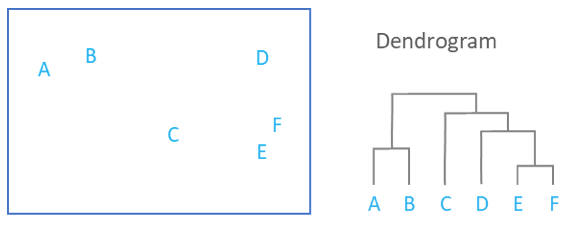
This image shows how a dendrogram would organize scatter plot data.
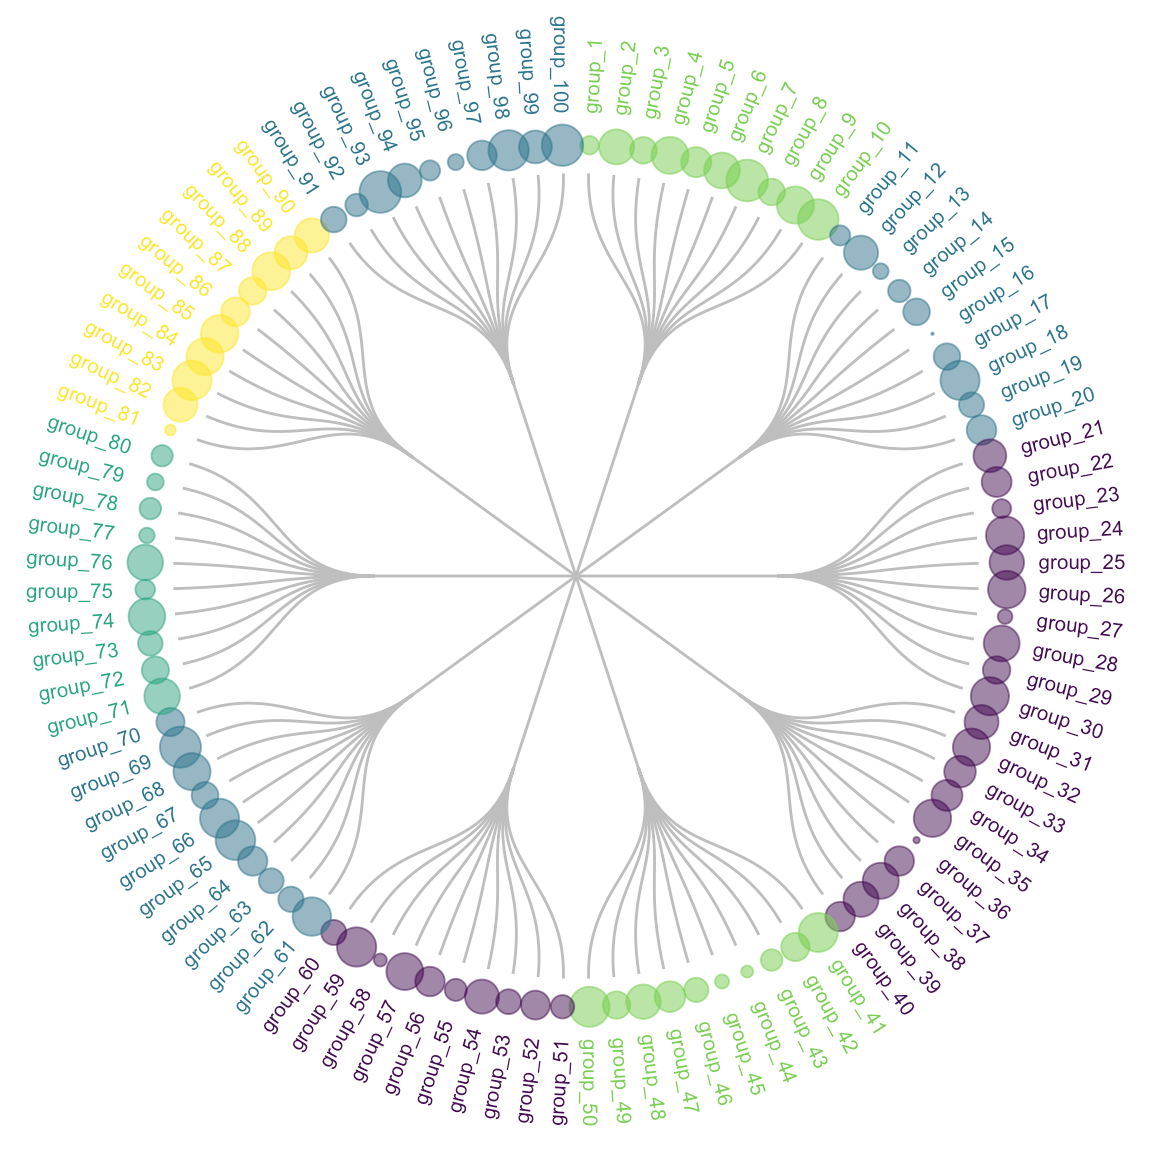
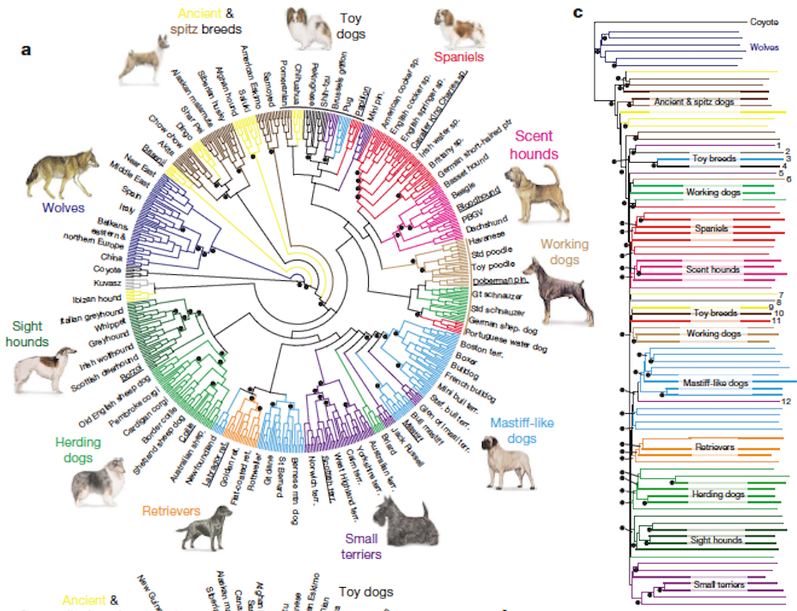
This is an example of how a dendrogram can be represented in a circular version. It is called a radial dendrogram.
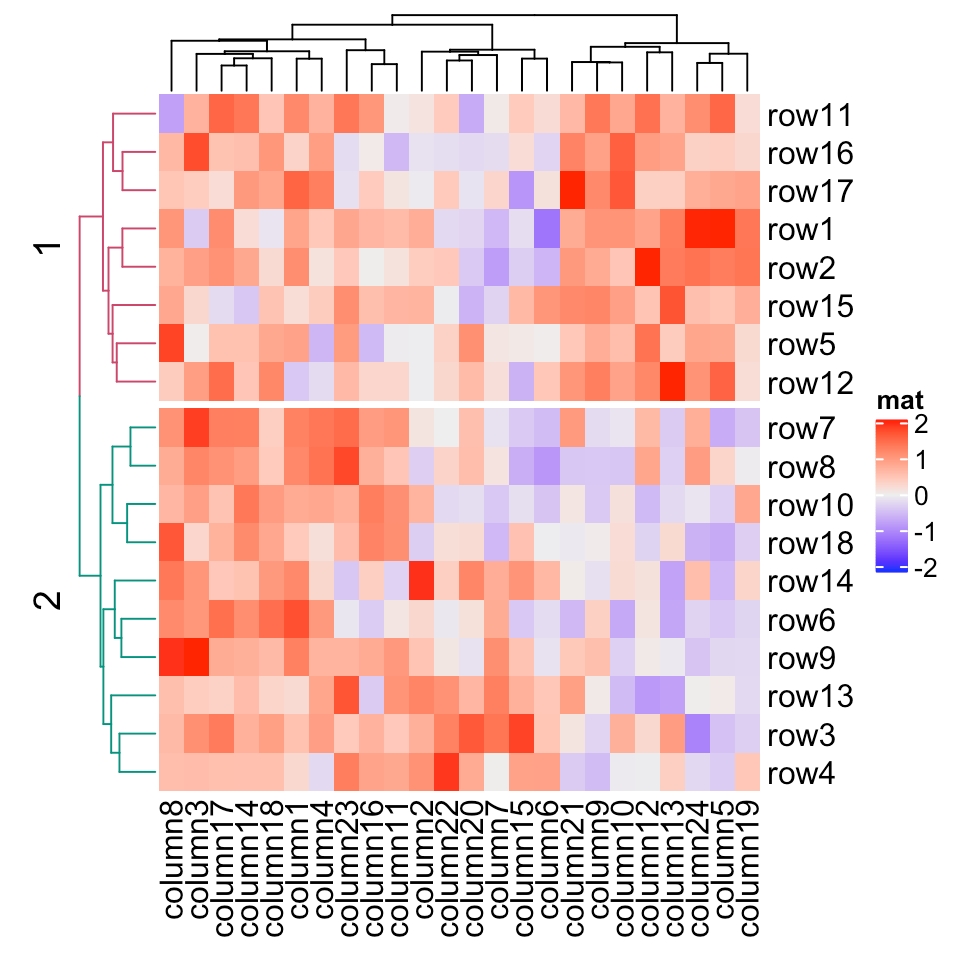
This shows how a heat map would be applied to a dendrogram.